Developments in the balance of travel services: 2025
07/05/2026 - Press Releases
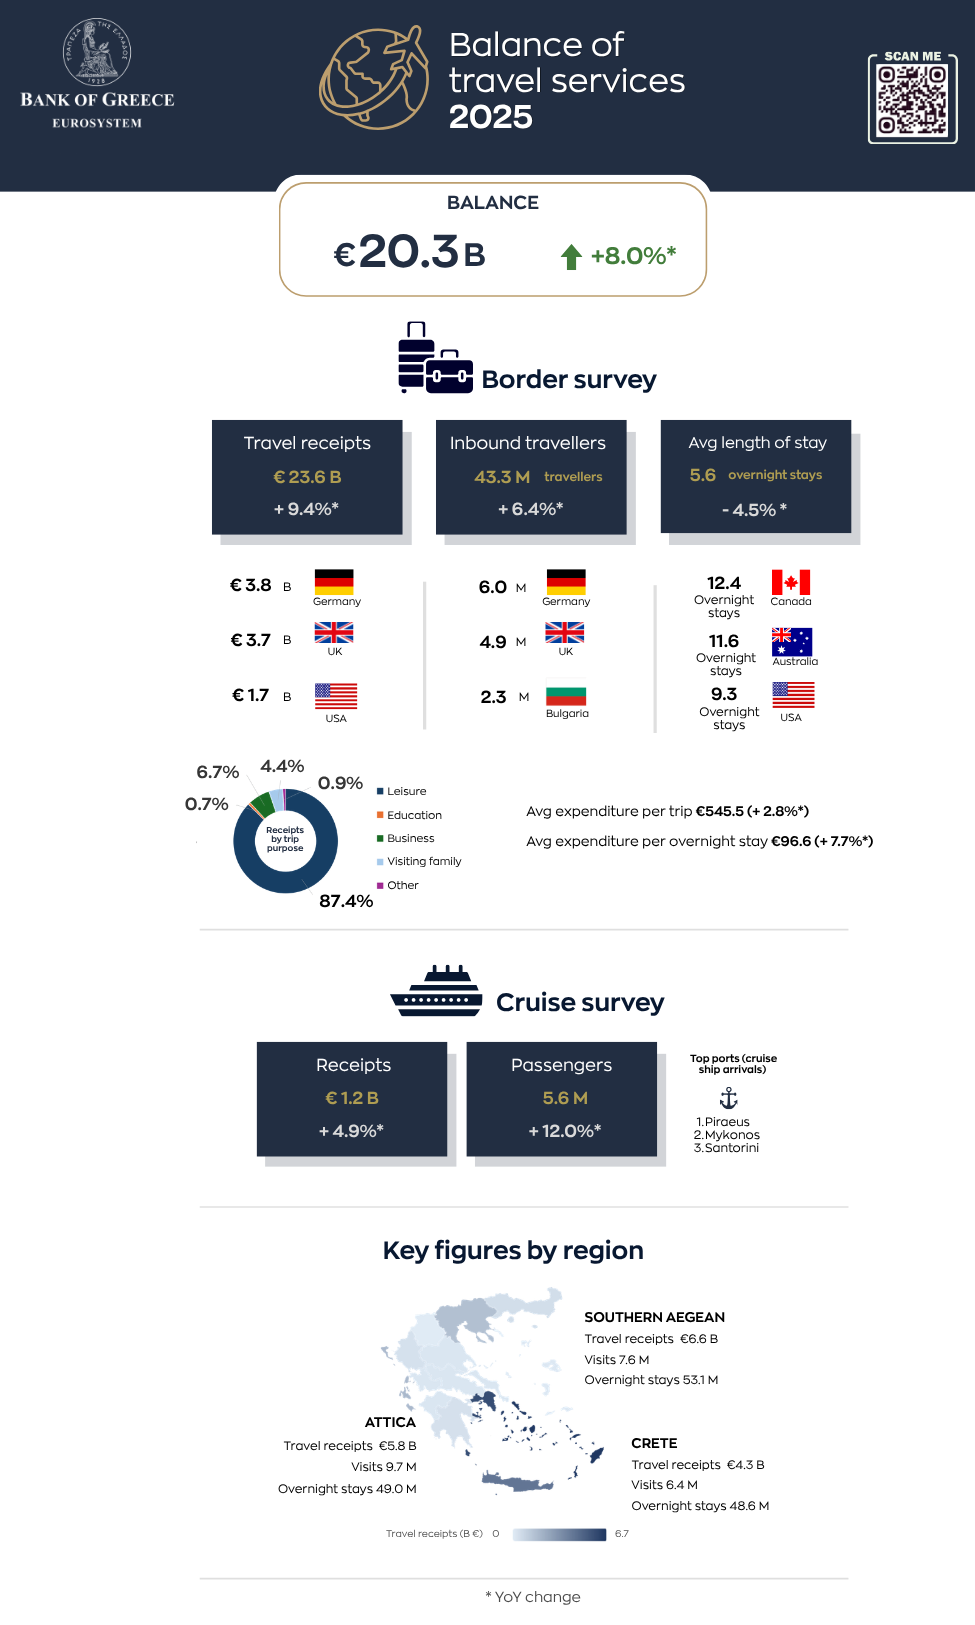
- The balance of travel services posted a surplus of €20,287.8 million in 2025.
- Travel receipts increased by 9.4% year-on-year.
- Inbound traveller flows grew by 6.4% compared with 2024.
- Overnight stays increased by 1.6% compared with 2024.
- Total receipts from cruise passengers rose by 4.9% compared with 2024.
- Attica was the most visited region in 2025, while the Southern Aegean region accounted for the largest share of both total receipts and overnight stays.
Balance of travel services
Based on final data, the balance of travel services in 2025 posted a surplus of €20,287.8 million, up by 8.0% from a surplus of €18,787.0 million in 2024 (Chart 1). This development was due to a larger increase in travel receipts (up by €2,034.5 million or 9.4%) than in travel payments (up by €533.7 million or 19.0%). The rise in travel receipts in 2025 compared with 2024 was driven by a 6.4% increase in the number of non-resident inbound travellers (Table 1), as well as by a rise in average expenditure per overnight stay by €6.9 or 7.7% (2025: €96.6, 2024: €89.7).
In greater detail, average expenditure per trip rose by 2.8% (2025: €545.5, 2024: €530.6), while the average length of stay fell by 4.5% to 5.6 overnight stays (2024: 5.9 overnight stays). Total overnight stays (Table 5) increased by 1.6% to 244,673.0 thousand in 2025, from 240,816.6 thousand in 2024.
Travel receipts
Travel receipts in 2025 totalled €23,626.8 million, up by 9.4% compared with 2024. This development was driven by a 6.0% increase in receipts from residents of the EU27 countries, which came to €12,689.2 million, or 53.7% of total travel receipts, and by a 15.0% rise in receipts from residents of other countries to €9,918.0 million (Table 2 and Chart 2).
In more detail, receipts from euro area residents rose by 4.0% year-on-year to €9,851.6 million in 2025, while receipts from residents of non-euro area EU27 countries increased by 13.9% to €2,837.6 million.
Among major countries of origin, receipts from Germany rose by 2.2% to €3,784.7 million as did receipts from France which increased by 5.6% to €1,330.1 million. Receipts from Italy grew by 4.9% to €1,285.7 million. Turning to other countries, receipts from the United Kingdom increased by 18.4% to €3,741.6 million, while receipts from the United States also rose by 9.7% to €1,736.7 million. Finally, receipts from Russia grew by 51.5% to €23.8 million.
Travel receipts by trip purpose
Looking at the breakdown of non-residents’ expenditure in Greece by trip purpose (Table 3 and Chart 3), trips for personal reasons represented the bulk of total travel receipts in 2025, with a share of 93.3% from 93.5% in 2024; the corresponding total receipts increased by 9.2%. Within this category, leisure accounted for the largest share in total receipts (2025: 87.4%, 2024: 87.1%). The corresponding receipts rose by 9.8% year-on-year to €20,647.0 million. Receipts from trips for the purpose of visiting family increased by 7.3%, but their share in total travel receipts stood at the same level as in 2024 (4.4%). Receipts from trips for health purposes dropped by 34.9% to €19.9 million. Finally, receipts from business trips rose by 12.9%, with their share in total receipts standing at 6.7% (2024: 6.5%).
Inbound traveller flows
As already mentioned, the number of inbound travellers in 2025 rose by 6.4% to 43,311.9 thousand, up from 40,693.9 thousand in 2024. Specifically, traveller flows through airports increased by 5.6%, while those through road border-crossing points rose by 6.9%. Travellers from within the EU27 countries accounted for 51.8% of the total number of travellers, while travellers from other countries accounted for 35.9%.[1] In 2025, travellers from within the EU27 countries rose by 2.8% compared with 2024. This development is attributed to an increase in the number of visitors from euro area countries by 7.1% to 15,523.5 thousand, whereas visitors from the non-euro area EU27 countries fell by 5.7% to 6,891.2 thousand. More specifically, travellers from Germany increased by 10.2% to 5,951.4 thousand and travellers from Italy rose by 8.6% to 2,200.5 thousand. Travellers from France decreased by 0.5% to 1,983.4 thousand.
Finally, the number of travellers from other countries grew by 10.0% to 15,566.4 thousand. Specifically, the number of travellers from the United Kingdom rose by 7.6% to 4,893.1 thousand, as did the number of travellers from the United States by 0.2% to 1,550.8 thousand. Finally, the number of travellers from Russia increased by 33.3% to 21.5 thousand (Table 4 and Chart 4).
Overnight stays[2]
In 2025, non-residents’ overnight stays in Greece totalled 244,673.0 thousand, up by 1.6% from 240,816.6 thousand in 2024. This is mainly attributable to a 2.0% increase in overnight stays of other countries’ residents. Especially regarding overnight stays by residents of the EU27, nights spent by euro area residents increased by 1.5%, while nights spent by residents of non-euro area EU27 countries fell by 4.1%. Specifically, the number of overnight stays increased by 2.1% year-on-year for German residents, whereas for French residents it remained relatively unchanged. The number of overnight stays increased by 5.8% for Italian residents. Turning to other countries, the number of overnight stays by UK residents rose by 6.8%, while the number of overnight stays by US residents fell by 2.5%. Finally, overnight stays by Russian residents increased by 27.6% (Table 5 and Chart 5).
Cruises
Since 2012, the Bank of Greece conducts a Cruise Survey in order to enrich the data collected through the Border Survey. Following a standardised methodology,[3] detailed cruise data for 2025 were collected at 16 Greek ports, covering 85.4% of all cruise ship arrivals in Greece.
Total receipts from cruise passengers in 2025 rose by 4.9% year-on-year to €1,166.3 million. Of this amount, €146.6 million were already captured in the Border Survey data, as they represent receipts from last port travellers, eventually leaving the country, while the remaining €1,019.7 million concern additional receipts data recorded by the Cruise Survey (Tables 6 and 7).
Chart 6 shows a breakdown of total cruise receipts by port. The port of Piraeus ranks first with a share of 49.3% in total cruise receipts, followed by the port of Corfu with 11.9% and the port of Heraklion with 7.6%.
The year under review saw 5,806 cruise ship arrivals (2024: 5,308). Total overnight stays ashore rose by 13.2% year-on-year to 14,021.5 thousand in 2025, with a positive impact on cruise receipts. The total number of cruise passengers rose year-on-year, by 12.0% to an estimated 5,612.7 thousand (Table 7Α).
Chart 7 shows a breakdown of cruise ship arrivals by port. The port of Piraeus ranks first with a share of 14.9% in total cruise arrivals, followed by the port of Mykonos with 13.1% and the port of Santorini with 12.5%.
In 2025, the total number of cruise passenger visits rose by 4.5% to 8,178.9 thousand, from 7,826.4 thousand in 2024 (Table 7Β). According to the Cruise Survey, 80.8% of all cruise passengers were transit visitors, with an average of 1.5 stopovers at Greek ports of call. The seven most important cruise ship ports account for 90.4% of total cruise receipts and 81.1% of total cruise passenger visits (Chart 6 and Chart 8).
Balance of travel services by region[4]
As shown by the Border Survey, travel receipts in 2025 amounted to €22,607.1 million. Five regions accounted for the bulk (89.9%) of total receipts (Table 8), namely: the Southern Aegean (€6,624.8 million), Attica (€5,838.2 million), Crete (€4,342.6 million), the Ionian Islands (€1,902.2 million) and Central Macedonia (€1,624.1 million). The remaining regions (Eastern Macedonia and Thrace, the Peloponnese, Epirus, Central Greece, Thessaly, Western Greece, the Northern Aegean and Western Macedonia) together accounted for €2,275,1 million.
Visits to Greece (all 13 regions combined) in 2025 totalled 41,749.3 thousand. The number of visits exceeds the number of inbound travellers estimated by the Border Survey (37,981.1 thousand), as travellers may visit more than one region during one trip.
Τhe five most popular regional destinations, accounting for 83.0% of total visits, were: Attica (9,705.2 thousand visits), the Southern Aegean (7,622.6 thousand), Central Macedonia (7,186.0 thousand), Crete (6,350.6 thousand) and the Ionian Islands (3,777.2 thousand). The remaining regions (Eastern Macedonia and Thrace, Epirus, the Peloponnese, Thessaly, Western Greece, Central Greece, the Northern Aegean and Western Macedonia) together accounted for 7,107.8 thousand visits.
The number of overnight stays in Greece in the period under review totalled 233,145.4 thousand. According to the breakdown into the 13 regions, five regions accounted for 87.9% of total overnight stays, namely: the Southern Aegean (53,123.9 thousand nights), Attica (48.984.1), Crete (48,621.9 thousand), Central Macedonia (28,352.9 thousand) and the Ionian Islands (25,859.2 thousand). The remaining regions (Eastern Macedonia and Thrace, the Peloponnese, Thessaly, Epirus, Western Greece, Central Greece, the Northern Aegean and Western Macedonia) together accounted for 28,203.5 thousand overnight stays.
Related link: Detailed and final data on the balance of travel services are published in the Travel services section of the Bank of Greece website.
[1] The remaining 12.3% corresponds to data on cruise passenger flows other than those collected through the Border Survey.
[2] It should be noted that each same-day visit, irrespective of duration, is counted as one overnight stay.
[3] Overall cruise data are thus derived from two sources:
(a) The Border Survey, which records data on cruise travellers leaving the country through a Greek point of exit (airport, road border-crossing point or seaport). In this case, the cruise data are integrated into the overall Border Survey statistics.
(b) The Cruise Survey was launched by the Bank of Greece in 2012. The survey is based on administrative data and seeks to capture the rest of cruise travellers, grouping them into: (i) travellers with a Greek embarkation port (home port); (ii) travellers with a Greek disembarkation port (last port); and (iii) transit travellers stopping over at Greek ports of call.
[4] The regional figures do not include cruise data collected from sources other than the Border Survey. As a result, they differ from aggregate data for travel services reported in the previous sections.