Commercial property indices - 2016 H2
18/05/2017 - Press Releases
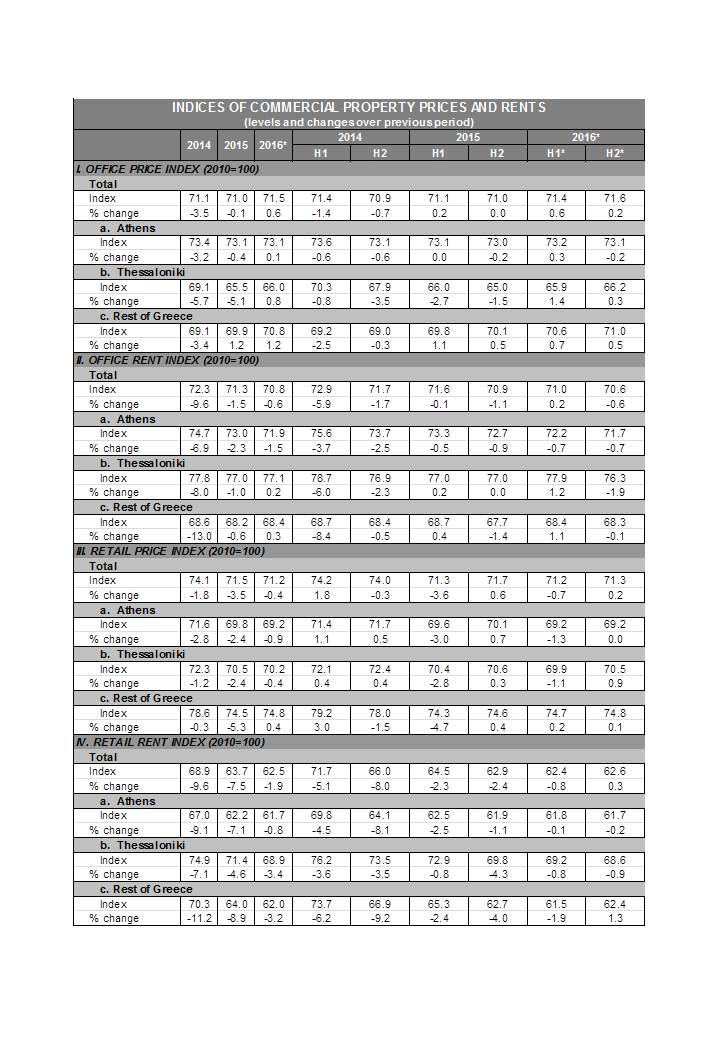
1. Office Indices
Office price index
According to provisional data, in 2016, nominal prime office prices increased on average by 0.6% relative to 2015, for the country as a whole, recording a positive rate of change for the first time since 2010. According to revised data, the corresponding rates of change were -0.1% in 2015 and -3.5% in 2014. Broken down by region, for the whole of 2016, nominal prime office prices increased marginally by 0.1% in Athens, whereas the corresponding rates of increase were 0.8% for Thessaloniki and 1.2% for the rest of Greece.
In the second half of 2016, nominal prime office prices for the country as a whole marginally increased by 0.2% compared with the first half of 2016 (provisional data). The corresponding rates of change recorded in the previous half-years were
0.0% for the second half of 2015 and 0.6% for the first half of 2016. More specifically, in the second half of 2016, nominal prime office prices declined marginally in the greater Athens area by 0.2%, whereas a marginal increase was recorded in both Thessaloniki and the rest of Greece, by 0.3% and 0.5%, respectively.
Office rent index
In 2016, office rents for the country as a whole decreased οn average by 0.6% in nominal terms (provisional data). The corresponding average annual rate of decline is estimated at 1.5% for Athens, whereas in Thessaloniki and in the rest of Greece a marginal increase of 0.2% and 0.3%, respectively, was recorded.
In the second half of 2016, office rents for the country as a whole declined by 0.6% compared with the first half of 2016 (provisional data), whereas in the previous half-years the respective rates of change were -1.1% for the second half of 2015 and 0.2% for the first half of 2016.
2. Retail indices
Retail price index
According to provisional data, in 2016, the average annual rate of decline in nominal prime retail prices for the country as a whole was 0.4%, having slowed down significantly relative to 2015 (-3.5%) and 2014 (-1.8%). Broken down by region, for the whole of 2016, the corresponding average annual rates of decline are estimated at 0.9% for Athens and 0.4% for Thessaloniki, whereas in the rest of Greece prices recorded a marginal increase of 0.4%.
In the second half of 2016, nominal prime retail prices increased marginally by 0.2% compared with the first half of 2016, for the country as a whole (provisional data). The corresponding rates of change were 0.6% in the second half of 2015 and -0.7% in the first half of 2016. In the second half of 2016, nominal prime retail prices remained unchanged from the previous half-year in the greater Athens area and increased by 0.9% in Thessaloniki and by a marginal 0.1% in the rest of Greece.
Retail rent index
For 2016 as a whole, retail rents declined on average by 1.9% for the entire country in nominal terms (provisional data). The corresponding rates of decline are estimated at 0.8% for Athens, 3.4% for Thessaloniki and 3.2% for the rest of Greece.
In the second half of 2016, retail rents for the country as a whole marginally increased by 0.3% compared with the first half of 2016 (provisional data). The corresponding rates of decline in the previous half-years were 2.4% for the second half of 2015 and 0.8% for the first half of 2016.
Detailed tables on retail and office prices and rents by geographical area are published in the “Bulletin of Conjunctural Indicators” (Tables ΙΙ.9, ΙΙ.10, ΙΙ.11 and ΙΙ.12) and are also available on the Bank of Greece website under “Real Estate Market Analysis”.
Source: Bank of Greece.
*Provisional data.
Notes:
1. For the purposes of monitoring and analysing the commercial property market, the Real Estate Market Analysis Section of the Bank of Greece compiles office and retail property indices, using data from credit institutions (Bank of Greece Executive Committee Act 23/26.07.2013) and Real Estate Investment Companies – REICs (Bank of Greece Executive Committee Act 9/10.01.2013) operating in Greece, as well as data from other sources, e.g. private real estate consultants, portfolio managers, real estate developers, real estate brokers and public sector entities. The data are collected on a biannual basis and include valuations, rents, transactions, investments and yields of commercial property and commercial property asset portfolios.
2. Indices are published on a biannual basis (base year: 2010). They concern office and retail uses and refer to price and rent levels of mainly prime investment property. It should be noted that price indices are valuation-based and are therefore expected to show some lag, especially in cases of negative changes. Furthermore, values tend to reflect sentiment and market expectations at the moment of the valuation, especially in periods of limited transactions.
3. Any inconsistencies between levels and percentage changes in the Table are due to rounding.